Data Quality Part 3: The Quantitative Components: Precision, Accuracy, and Completeness
Posted: June 22nd, 2023
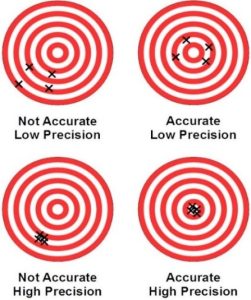
We started this journey with the following thought: Defining data quality and implementing a data quality program furthers the goal that the data collected serve the intended purpose, i.e., informed decision making. Last time we discussed that precision is a measure of repeatability and that accuracy is a measure of correctness (agreement with the true value). The attached graphic shows precision and accuracy using targets and arrows (or darts, if you wish). Of course, when we make a measurement, we don’t know the true value. And, based on our discussions in the first article in this series, different data uses have different needs for precision and accuracy.
Let’s try a different analogy for this: weighing myself using the bathroom scale. I don’t know the “true” value (although maybe there is an “expected” value ). I can get precision by getting on and off the scale multiple times. But accuracy is harder. I could put a known weight on the scale, or I could climb on the scale, and then pick up the known weight. But I have to accept that accuracy for those two proxies (a known that’s not me or an addition to the unknown that is me), are reflective of the accuracy in the measurement of me.
So, how do we put numbers around precision and accuracy? It’s interesting, we tend to measure and put limits around inaccuracy and imprecision. Precision is generally reported as a deviation from a mean (standard deviation, percent difference, etc.), and the limits are maxima (e.g., relative standard deviation below 15%). Highly reproducible values will have very small deviations. Accuracy can be reported as the error, or deviation, from the expected or true value. Accuracy can also be measured as “recovery” (which messes with my observation above, about measuring inaccuracy). Very accurate results will have very small errors and recoveries very near 100%.
And how do we measure accuracy, especially if we don’t know the true value? Because when you measure an unknown you don’t know the true value. Ever. All measurements are an estimate of true value. As described above in my adventure with the bathroom scale, we must develop some proxy indicator of accuracy, some indicator of measurement performance. It must be the measurement of some known (or knowable) value. To make the logical jump from the proxy indicator to the actual measurement, there must be robust procedure and activity performance control. That’s just a fancy way to say, “we know how we do things and we do them that way each and every time”. We must know that our proxy was handled as closely as possible to how our unknown is handled.
Ok, so how do we measure precision? Simply put, we do repeated measurements. On and off the bathroom scale. (Maybe if I do that enough times, I’ll lose a couple pounds?)
Let’s switch from my bathroom scale analogy to analyzing an environmental sample. We still don’t know the “true” or “expected” value, but (big surprise!) we have a few tools that can be used to assess accuracy and/or precision. In the discussion below, “matrix” is the physical or chemical form of the sample and “analyte” is the target we’re looking for.
- To determine accuracy in the sample analysis, some possible tools include:
- Measurement of a known matrix that is as similar as possible to our unknown matrix. This might be a reference standard or an audit sample.
- Measurement of a spike. That is, a known amount of analyte is added to a split of an unknown. The “true” or “expected” level is the measured unknown plus the known addition. This is the lab equivalent to me picking up a weight on the bathroom scale. Spikes can be prepared at any of the sample processing steps (sample collection, sample recovery, extraction, digestion, dilution, clean‑up, and analysis).
- A spike can be prepared on a clean matrix, in which case there is only the spike.
- Addition and measurement of a known amount of a similar analyte (surrogate) that is not present in the actual unknown sample. (This might be an isotopically-labeled compound.)
- Measurement of calibration standard(s). This can be done once, or multiple times over an analytical sequence. It can be the actual calibration standard or a “second-source” standard used for confirmation.
- To determine precision in the sample analysis, there are many tools to choose from:
- Two (or more) samples collected simultaneously (field duplicate/replicate).
- Two (or more) analyses of the sample itself (lab duplicate/replicate).
- Splits at any of the processing steps (sample collection, sample recovery, extraction, digestion, dilution, clean‑up, and analysis).
- Any of the spikes prepared in duplicate (and they frequently are).
- If we do surrogate spikes, we can also pool the surrogate results/recoveries across multiple samples.
The last quantitative data quality objective is completeness. It’s also the easiest: How many samples did you plan to get, and how many did you actually get? For a very small program (e.g., our stack test), we target as few as 3 measurements (for each analyte), and our completeness objective is 100%.
It’s not really as hard as it sounds. Most (if not all) of the activities described above are in place in the methods and are implemented (and controlled and reported) by the analytical laboratory. As an end-user, or a definer of the data quality objective (DQO), you need to select the subset of quality activities which become the project-specific data quality objectives. And that is based on the end use of the resulting data (the underlying question).
Next Time: Comparability and Representativeness
Until then, feel free to contact either of us:
- Gene Youngerman, gyoungerman@all4inc.com, 512.649.2571
- Aditya Shivkumar, ashivkumar@all4inc.com, 281‑201-1239
Links to other blogs from our Data Quality Series: