EPA Publishes 29th Annual U.S. Greenhouse Gas Inventory
Posted: June 15th, 2022
Authors: Madison J.
In April 2022, the United States Environmental Protection Agency (U.S. EPA) released the 29th annual Inventory of U.S. Greenhouse Gas Emissions and Sinks (GHG Inventory).
Background
Since 1990, the U.S. EPA has developed a nationwide GHG inventory, engaging researchers, federal partners, stakeholders, consultants, industry, and environmental organizations. The GHG inventory includes carbon dioxide, methane, nitrous oxide, hydrofluorocarbons, perfluorocarbons, sulfur hexafluoride, and nitrogen trifluoride emissions. The final GHG emissions number is calculated using the total GHG production from man-made sources minus the total carbon dioxide stored in carbon sinks. Carbon sinks are sources that remove carbon dioxide from the atmosphere including, but not limited to, forests, vegetation, soils, and the ocean.
The Greenhouse Gas Reporting Program (GHGRP), promulgated at 40 CFR Part 98, established mandatory GHG reporting requirements for owners and operators of certain industrial facilities. The GHGRP is used by the GHG Inventory to quantify and better understand the sources and types of GHG emissions emitted from U.S. industry. The GHGRP does not cover all annual U.S. greenhouse emissions and sinks (e.g., the GHGRP does not include emissions from the agricultural, land use, and forestry sectors), but it is an important component in the calculation of national-level emissions in the Inventory. Between the GHGRP and the GHG Inventory, you can find the total U.S. GHG emissions, review trend data for the past 25 years, browse a map to find the largest emitters in your area, compare facility emissions across an industrial sector, and find reported GHG emissions by state.
Key Takeaways from the 2020 U.S. GHG Emissions Inventory
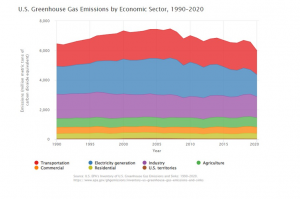
U.S. GHG emissions decreased 9% from 2019 to 2020 mostly due to impacts of the COVID-19 pandemic on travel and economic activity. The decrease is also said to have resulted from energy market trends, technological changes, and carbon intensity of energy fuel choices.
The largest source of U.S. GHG emissions in 2020 was the transportation sector (27%), closely followed by the electricity sector (25%) and industry sector (25%). The commercial and residential sectors accounted for 13% of U.S. GHG emissions, and the agriculture sector accounted for 11% of the U.S. GHG emissions.
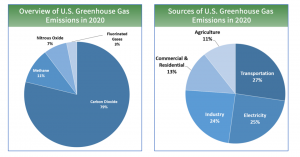
Note: All emissions estimates from the Inventory of U.S. Greenhouse Gas Emissions and Sinks: 1990–2020.
Exploring the U.S. GHG Inventory
The U.S. EPA GHG Inventory website (https://www.epa.gov/ghgemissions/inventory-us-greenhouse-gas-emissions-and-sinks) provides several resources from the GHG Inventory, including a full 1990-2020 inventory report, an annual fast fact sheet, data highlights, an interactive inventory data explorer, and other specific information. The inventory data explorer allows you to filter information based on sector, category, GHG, year, and geography; this can be a useful tool to compare a facility’s emissions with other similar facilities.
What is the GHG Inventory used for?
The GHG Inventory is used for several purposes:
- Educating citizens on U.S. GHG emissions
- Informing the U. S. EPA, researchers, federal partners, policymakers, and stakeholders
- Submitting GHG emissions to the United Nations Framework Convention on Climate Change (UNFCC)
- Comparing GHG emissions between sectors and emitters
- Tracking year to year changes
If you have any questions about GHG inventories and how ALL4 can assist you, please contact ALL4’s Technical Director for Climate Change and Sustainability, Daryl Whitt at dwhitt@all4inc.com or 987.777.3076.