PM2.5 Annual NAAQS Proposed to be Lowered
Posted: January 11th, 2023
After completing the White House Office of Management and Budget (OMB) review on December 27, 2022, the much anticipated proposal to lower the annual particulate matter of less than 2.5 microns (PM2.5) National Ambient Air Quality Standard (NAAQS) was officially signed on January 6, 2023. U.S. EPA is proposing to lower the standard from the current 12 micrograms per meter cubed (µg/m3) to a level between 9 µg/m3 and 10 µg/m3. As you plan out your 2023 here are some things to consider to put yourself in the best position once the new standard is finalized later this year.
- Check to see what the current PM2.5 design value is in your area to understand if there is the potential for your area to be classified as a PM2.5 nonattainment area and/or how much “headroom” is available for PM2.5 NAAQS air quality modeling demonstrations.
- Review your current PM2.5 emissions inventory and consider refining overly conservative emissions factors or assumptions, such as the use of particulate matter (PM) or particulate matter less than 10 microns (PM10) to represent PM2.5.
- Consider emissions measurements to improve your emissions inventory.
- Conduct PM2.5 air dispersion modeling to assess your status with the PM2.5 NAAQS and to identify areas for improvement through stack modifications and/or equipment and process changes.
- Consider an ambient PM5 monitoring program to establish site-specific background concentrations or to be utilized in lieu of a required air dispersion modeling demonstration.
- If it’s anticipated that you’ll end up in or near a PM2.5 nonattainment area, consider projects that can reduce PM2.5 emissions. PM2.5 emissions reductions could be used for future projects at your facility or have the potential to be worth a lot of money as emissions reduction credits (ERCs) to other facilities in your area.
For more details on the proposed new PM2.5 NAAQS and how it will impact the regulated community read on.
As part of U.S. EPA’s proposed reconsideration of the NAAQS for PM they also proposed to retain the current PM2.5 secondary annual NAAQS (15 µg/m3), PM2.5 primary and secondary 24-hour NAAQS (35 µg/m3), and primary and secondary PM10 24-hour NAAQS (150 µg/m3). U.S. EPA will consider public comments on the proposed rule in their ultimate selection of the level of the standard when the rule is finalized later this year. U.S. EPA also indicated in the proposal that they would also take comment on the full range (8 µg/m3 to 11 µg/m3) considered by the Clean Air Scientific Advisory Committee (CASAC). CASAC had also proposed lowering the 24-hour PM2.5 NAAQS from the current 35 µg/m3 to a range of 25 µg/m3 to 30 µg/m3. In U.S. EPA’s decision to retain the current PM2.5 24-hour NAAQS they considered their decision in conjunction with the protection provided by both the 24-hour PM2.5 NAAQS and proposed decision to lower the annual PM2.5 NAAQS.
U.S. EPA is also proposing to update PM2.5 ambient monitoring requirements to include network design criteria to include an environmental justice factor that would require PM2.5 ambient monitors to be sited in at-risk communities. In addition, U.S. EPA is proposing revisions to data calculations used to quantify design values used for assessing attainment status with the new lowered PM2.5 NAAQS. Also related to PM2.5 ambient monitoring, U.S. EPA is soliciting comments on how advanced and emerging PM monitoring techniques, such as low-cost air sensors, can assist in non-regulatory air quality data needs, siting regulatory monitors, or identifying sources to consider in developing State Implementation Plans (SIPs).
Once finalized the regulated community will be immediately impacted by permitting requirements that contain NAAQS air quality modeling demonstrations. The major difficulty in PM2.5 NAAQS air quality modeling demonstrations lies in U.S. EPA’s current conservative requirement to add an ambient monitoring design value to modeled design value concentration. This conservative approach leaves little “headroom” for projects when considering the current (2019-2021) average annual PM2.5 design value across all U.S. PM2.5 ambient monitoring stations is 7.9 µg/m3. This conservative approach is compounded by difficulty measuring PM2.5 emissions (especially for wet and fugitive sources) and updated requirements outlined in my August 2022 Blog post for accounting for PM2.5 precursor impacts from nitrogen oxides (NOX) and sulfur dioxide (SO2).
The other major impact to the regulated community will take a little longer to hit once the PM2.5 NAAQS is lowered. States will have to begin the designation process for a new PM2.5 NAAQS based on current PM2.5 ambient monitoring data, and that could take up to two years. Areas not in attainment with a new lowered PM2.5 NAAQS will be designated nonattainment, which will trigger nonattainment new source review (NNSR) permitting requirements that contain more stringent Lowest Achievable Emissions Rate (LAER) requirements and involve purchasing costly PM2.5 emission reduction credits (ERCs). The cost of PM2.5 ERCs will be driven by supply and demand and there is the potential for some areas to have no available PM2.5 ERCs which may necessitate obtaining PM2.5 precursor pollutant (NOX and SO2) ERCs which is currently allowed at higher offset ratios. To get an idea of the possible number of new nonattainment areas, U.S. EPA published a table summarizing the current annual PM2.5 design values (2019 -2021) for all PM2.5 ambient monitors in the U.S. Currently, there are 18 PM2.5 ambient monitors with design values greater than the current 12 µg/m3 annual PM2.5 NAAQS. A decrease to 10 µg/m3 would increase this amount to 52 and a decrease to 9 µg/m3 would increase this amount to 119. For those engineer and scientist readers that love data, below is a box and whisker plot of the current annual PM2.5 NAAQS design values for all U.S. ambient monitors. The box portion of the plot represents the 1st quartile to 3rd quartile range from the dataset, the whiskers represent 1.5 times the interquartile range (Q1-Q3), and the dots represent the data outside of 1.5 times the interquartile range.
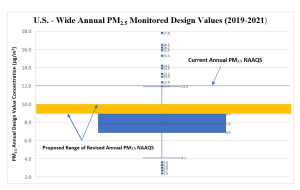
What this box and whisker plot demonstrates is that a new PM2.5 NAAQS is just outside the 3rd quartile, meaning that not only will there be an increase in nonattainment areas but there will be little “headroom” in those areas below the proposed new PM2.5 annual NAAQS, which will make air quality modeling difficult as outlined above. As a result, NNSR permitting may be less restrictive than Prevention of Significant Deterioration (PSD) air quality modeling requirements. The other good news is there is still some time to go through the permitting process and get a permit issued before the PM2.5 NAAQS is lowered. In addition, there will be more time (at least 2 years) to go through the PSD permitting process for those areas that may be designated as nonattainment areas before more stringent NNSR permitting requirements are established. However, expect opposition during any public comment period if there is a pending lower PM2.5 NAAQS or pending nonattainment area.
ALL4 will continue to monitor the status of NAAQS-related changes and how the changes will impact the regulated community. For more information or for help assessing how these changes will affect your facility, please contact Dan Dix.