March Madness – NAAQS Update
Posted: March 23rd, 2015
You don’t need to work in the air consulting arena for very long to see some big changes. I’ve been helping clients with air permitting, strategy, and compliance for 11 years, so I’m a relative newcomer. One of my former colleagues, Marvin Gregory, once told me a story about hand delivering a construction permit application to a state agency on the day before the Prevention of Significant Deterioration (PSD) permitting program became effective in 1977. I haven’t been at it for as long as Marvin was, but still long enough to see one very important change: the importance of the National Ambient Air Quality Standards (NAAQS). In my time in the consulting arena, the NAAQS have gone from a general PSD permitting nuisance to a full blown project stopper. You have seen ALL4 documenting the corresponding evolution of the NAAQS levels since the current U.S. EPA administration started in January 2009, and we will continue to follow them closely and provide you with updates that we think are important to your operations. The following sections provide updates on the most important NAAQS and how you can plan for them today.
Sulfur Dioxide (SO2)
U.S. EPA has already established 30 nonattainment areas for the 1-hour SO2 NAAQS on the basis of existing ambient monitoring data. The next step in the implementation process is the one that will have the biggest impact on many more facilities: assessing attainment status in those areas for which ambient monitoring data is not available. To address these areas U.S. EPA proposed the Data Requirements Rule (DRR) outlining the approach by which state agencies should evaluate the attainment status in yet to be designated areas. The DRR is still only proposed but is listed for promulgation in September 2015, so stay tuned. The most important aspect of the DRR is that it applies to individual facilities that will be faced with the burden of a NAAQS compliance demonstration. The following subsections outline the primary components of the DRR and what they mean.
Who is subject?
U.S. EPA outlined three (3) options for determining which facilities would be specifically assessed based on each facility’s actual annual emissions and the surrounding population. If your facility falls within Option 1 (U.S. EPA’s preferred option), now is the time to be planning for the DRR.
Summary of Thresholds for Targeted Facilities
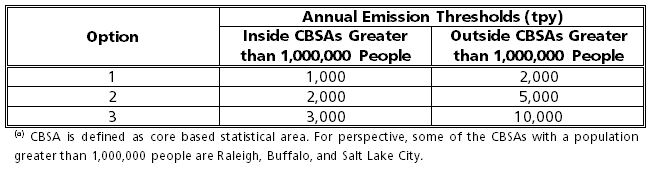
What evaluations need to be conducted for subject facilities?
U.S. EPA outlines two (2) primary options to assess NAAQS attainment for the facilities discussed in the previous section:
- Conduct an air dispersion modeling evaluation; or
- Install an ambient monitor or monitors in the vicinity of the facility to measure ambient concentrations.
The approach selected will depend on the philosophy of each respective state agency. Several agencies that we have talked with will allow facilities to select the approach. Others would prefer to use dispersion modeling if it demonstrates NAAQS attainment but will transition to the installation of ambient monitors if the modeling doesn’t demonstrate attainment. Still others are opposed to any dispersion modeling for NAAQS designations and will focus exclusively on the installation of ambient monitors. One (mostly) common thread: state agencies do not have the resources or funding to perform these evaluations so the burden will fall on facilities to do so.
How does the air dispersion modeling evaluation work?
The following items highlight the key aspects of a dispersion modeling evaluation as outlined in U.S. EPA’s Technical Assistance Document (TAD) for 1-hour SO2NAAQS dispersion modeling:
- AERMOD (U.S. EPA’s preferred regulatory dispersion model) will be the model that is used for the evaluation (similar to PSD modeling)
- Ambient background concentrations must be added to modeled concentrations (similar to PSD modeling)
- Building downwash and wake affects must be accounted for (similar to PSD modeling)
- Representative meteorological data must be used. The meteorological data will typically cover a period of three (3) calendar years to match the form of the 1-hour SO2 NAAQS.
- Actual stack heights in excess of good engineering practice (GEP) stack heights should be modeled (distinctly different from PSD modeling)
- Modeling receptors should be placed in any location where an ambient monitor could be installed. As an example and unlike PSD permit modeling, a receptor would not be placed over a body of water.
- Actual emission rates that vary by hour over a period of three (3) years matching the modeled meteorological data should be used. This is designed to simulate “actual” concentrations and is a big departure from PSD modeling where maximum emission rates are considered. While there are great benefits to using actual emissions, it requires more data intensive modeling evaluation. Emission rates that vary every hour result in 26,280 hours of emissions data for a single emission point over a three (3) year period.
Modeled concentrations are combined with ambient background concentrations and compared to the 1-hour SO2 NAAQS (75 ppb). If modeled concentrations are less than the NAAQS level, don’t assume you are done. The proposed rule has several options for what facilities will be required to do on an ongoing basis. Two (2) of the options include updating future dispersion modeling with future meteorological data. If modeled concentrations are close to the NAAQS, future meteorological data could result in concentrations in excess of the NAAQS, so tread carefully when committing to the dispersion modeling compliance option. When we recommend that facilities start planning ahead, the modeling evaluation described here is a good start.
How does the ambient monitoring evaluation work?
There are several ways to determine where SO2 ambient monitors should be installed. The most likely used scenario is to use the dispersion modeling described above to determine where the relative maximum concentrations of SO2 occur and install monitors in those locations. Based on U.S. EPA’s TAD related to 1-hour SO2 NAAQS ambient monitoring, the dispersion modeling used to locate a monitor will look the same as the previously described modeling with the following exceptions:
- Emission rates can be “normalized” or scaled down so a given emission rate is set to 1 lb/hr and other hourly emission rates are scaled accordingly.
- Greater emphasis will be placed on where modeled receptors are placed. They shouldn’t be placed anywhere that an ambient monitor could not be sited. Monitor access, power and data, and a number of other considerations need to be made to determine where an ambient monitor could realistically be placed.
The dispersion modeling evaluation is used to identify a location or locations of maximum SO2 concentrations per U.S. EPA’s ambient monitoring TAD. The goal of the evaluation is to minimize the scope of the ambient monitoring network while still providing the state agency assurance that the maximum concentrations are being measured.
What is the timing for these requirements?
We have received feedback that U.S. EPA may not change the milestones proposed in the DRR despite the delay of the DRR promulgation. Here are some of the key timelines as proposed in the rule:
- January 15, 2016: Decision on the approach that each subject facility will use and, for those facilities that will conduct dispersion modeling, the submittal of a dispersion modeling protocol.
- July 2016: Ambient monitoring plans submitted to U.S. EPA for those facilities conducting ambient air monitoring.
- January 2017: Final dispersion modeling evaluations submitted and new ambient monitors begin operation.
By August 2017 the dispersion modeling based designations will become final. By December 2020, after three years of ambient monitoring, the monitoring based designations will become final. Considering the imminent deadlines, the submittal of a modeling protocol in January 2016 means that facilities subject to the rule need to understand their modeled SO2 impacts right now to allow sufficient time for strategic planning prior to submitting a protocol.
Anything else related to SO2 I should be worried about?
There is one significant item that applies to the very largest SO2 emitters. A consent decree granted in early March 2015 applies to the following facilities:
- Any facility that emitted more than 16,000 tpy of SO2 in the 2012 calendar year; or
- Any facility that emitted more than 2,600 tpy of SO2 in the 2012 calendar year AND that had an average SO2 emission rate of greater than 0.45 lb/MMBtu in 2012.
These facilities will be subject to an accelerated timeline of 16 months from the finalization of the consent decree to promulgation of a final NAAQS designation. This consent decree establishes binding deadlines even if the DRR is not adopted. It appears that this timeline removes a requirement for a new ambient monitor that would need to operate for three years from consideration as an option. There are still questions to resolve about how the 0.45 lb/MMBtu emission rate in the Consent Decree applies to non-utility sources and process sources. These are important questions that we will continue to work with state agencies to answer in the near term.
Ozone
The revised 8-hour ozone NAAQS is still scheduled for promulgation in October 2015. It is expected to fall within a range of 60 to 70 parts per billion (ppb) versus a current NAAQS level of 75 ppb. The result will be an expansion of existing ozone nonattainment areas and the formation of new ozone nonattainment areas. Being located in a nonattainment area means the following:
- Obtaining a construction permit for new projects could become more difficult as a result of lower major modification thresholds for volatile organic compounds (VOCs) and oxides of nitrogen (NOX) along with the requirement to meet the Lowest Achievable Emission Rate (LAER) and to purchase emission offsets when triggering major modification requirements.
- Even facilities not implementing a project could still be hit with more stringent emission limits as a result of the state agencies required plans to achieve NAAQS compliance through the Reasonably Available Control Technology (RACT) regulatory process.
We will continue to keep you updated on the ozone NAAQS. For now, if there are major permitting efforts coming up consider expediting those permitting evaluations to avoid possible nonattainment requirements. In addition, if you have recently made VOC or NOX emission reductions in possible future ozone nonattainment areas consider documenting those reductions and understand what their value as emission offsets could be on the open market.
Fine Particulate Matter (PM2.5)
U.S. EPA recently finalized designations for the 2012 PM2.5 annual NAAQS of 12 micrograms per cubic meter. They also deferred certain designations based on incomplete ambient monitoring data. Those deferred designations will be finalized after the 2014 calendar year data are validated. A map of the latest designations and deferred areas can be found here. Be sure to understand the current attainment status of your area. The PM2.5 NAAQS continues to be one of the more difficult standards to demonstrate compliance with through PSD air dispersion modeling (largely because background concentrations in and of themselves often approach the NAAQS), so it’s always important to understand where your available emission reduction opportunities exist in order to net out of PSD permitting requirements for upcoming projects.
If you have any questions about the SO2 NAAQS or other NAAQS levels feel free to contact me at (678) 460-0324, extension 206 or at cmccall@all4inc.com. For our prior updates on the SO2 NAAQS visit our DRR webpage. Continued best wishes to you as we all try to navigate this maze or air regulations (and standards) together.