Environmental Justice Tools Update: EJScreen 2.1 and CEJST 1.0
Posted: December 7th, 2022
U.S. EPA Releases EJScreen 2.1
On October 11, 2022, the United States Environmental Protection Agency (U.S. EPA) released a new version of their EJScreen tool, EJScreen 2.1. EJScreen is an environmental justice (EJ) screening and mapping tool that combines environmental and socioeconomic information to identify areas that may be considered overburdened. EJScreen 2.1 includes new data and coverage and incorporates several new features. Here are the changes to EJScreen in version 2.1:
New Data
- EJScreen 2.1 now includes environmental, demographic, and index data for the US Virgin Islands, Guam, American Samoa, and the Northern Mariana Islands. Data was not previously available in the tool for these areas. The data sets available for these areas are not as complete as they are for the continental United States, but the data that is available has been incorporated into the tool to begin covering those areas and set the stage for greater coverage in future versions.
- All EJScreen 2.1 data has been updated to use Census American Community Survey (ACS) 2016-2020 5-Year Estimates.
- EJScreen 2.1 now uses the term “Linguistically isolated” instead of “Limited English Speaking” to align with the most recent nomenclature used by the U.S. Census.
- EJScreen 2.1 includes new tribal and indigenous and colonias map layers. Tribal and indigenous areas, like areas with larger percentages people of color and low income, have experienced disproportionate effects of pollution. Colonias areas often have inadequate potable water supply, sewage systems, and/or housing. Both areas are more sensitive to the effects of emissions and pollution and are often considered overburdened.
- Additional data, such as new Superfund source data and new Risk Management Program (RMP) facility source data have been incorporated. A full list of the new data sets added can be found HERE.
New Features
- With the release of EJScreen 2.1, U.S. EPA added Supplemental Indexes. Supplemental Indexes are like EJ Indexes in that there are the same 12 Indexes as the EJ Indexes but the Demographic Index, which is used to weigh the Environmental Indicators and create the EJ / Supplemental Indexes, is calculated differently:
- For EJ Indexes, the Demographic Index is the average of the percent low income and percent people of color Socioeconomic Indicators.
- For the Supplemental Indexes, a new five-factor supplemental demographic index is used, which is the average of percent low-income, percent limited English-speaking, percent less than high school education, percent unemployed, and low life expectancy.
- S. EPA has indicated that while the Supplemental Indexes have been included to allow users to look at the data from a different point of view, they will continue to rely on the EJ Indexes in making determinations as to whether a community is overburdened.
- EJScreen 2.1 now includes threshold maps.
- Threshold maps allow a user to select data type (EJ Index or Supplemental Index), data source (US or State Percentiles), Index Percentile Range, and all indexes or selected subset of indexes.
- This allows a user to evaluate areas for multiple contributors for EJ and supplemental indices. For example, a user can identify areas that have a percentile above 80 for both Air Toxics Cancer Risk and Superfund Proximity and see if there may be a correlation between the two factors, either on a state or federal level. The user can also identify census tracts that have a set number of Indexes over a certain percentile, etc.
Method Changes
- The Method for calculating the EJ index has been updated in the new version. The calculation methods are shown below.
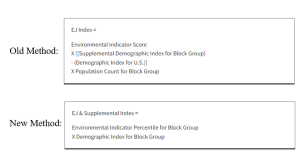
- Percentiles no longer use a floor method and now instead use a ceiling method, meaning it uses the lower value in case of ties instead of higher. This means some areas may now be below the 80th percentile (the commonly accepted threshold for EJ communities) that were previously above.
- The new method results in an index that considers only the environmental impacts and demographic index, which is a more conservative approach than the previous one that also considered population weights.
CEJST Version 1.0
On November 22, 2022, the White House Council on Environmental Quality (CEQ) released the first formal version of the Climate and Economic Justice Screening Tool (CEJST), which identifies communities eligible for funding under the Justice40 initiative by classifying them as disadvantaged.
The Beta release was met with significant criticism from EJ interest groups for excluding race as a metric over legal concerns. Race is partially addressed in the new version of the tool through the redlining indicator. Redlining is a discriminatory practice where services are denied to potential customers who live in communities classified as high risk for investment. These communities often have a high percentage of minority or low-income populations. Other additions include information about climate risks, transportation inequities, and legacy pollution. The tool incorporates a number of new datasets and also an updated methodology for determining whether a community is disadvantaged. The tool identifies an additional 3,781 communities as disadvantaged, including the designation of all Federally recognized tribes as disadvantaged. Communities are considered disadvantaged if they are at or above the threshold for one or more of the eight categories of burden identified by the tool and are at above the threshold for one of the socioeconomic burdens associated with that category. The eight categories of burden are:
- Climate Change
- Energy
- Health
- Housing
- Legacy Pollution
- Transportation
- Water and Wastewater
- Workforce Development
Additionally, a census tract that is surrounded by disadvantaged communities and is at or above the 50th percentile for low income is now also considered disadvantaged.
How to Use the Tools
although many states do not currently require EJ reviews before permitting new sites or any retroactive analyses, it is important to know your facilities’ EJ footprints prior to undertaking permitting efforts to inform what additional requirements might be required or what the public response might be. If you have previously run the tools for your facilities, you may want to look at the new versions of the tools to see if you get different results. The results of the tools should also be considered when siting new facilities. ALL4 recommends that industry engage nearby communities (overburdened or not) to provide a seat at the table to air potential concerns and develop open communication with those communities prior to undertaking projects that may impact those communities.
ALL4 is tracking the status of state and federal EJ tools and the regulatory and policy developments around EJ. If you need help conducting a review of your facility’s EJ footprint or want to discuss what your state is doing in terms of EJ policy and programs, contact your ALL4 project manager or email info@all4inc.com, we’re here to help!