2025 Annual U.S. Greenhouse Gas Inventory
Posted: June 25th, 2026
Author: Josh Bradford
The United States Environmental Protection Agency (U.S. EPA) has historically published an annual Inventory of U.S. Greenhouse Gas (GHG) Emissions each year, compiling data ranging back to 1990. The report provides information on the sources and sinks of GHG in the U.S. and helps inform climate change-related policy decisions both domestically and internationally. The most recent report was published in 2024, covering years 1990-2022, as required by the U.S.’s participation in the United Nations Framework Convention on Climate Change (UNFCCC). A draft inventory was posted in January 2025 with a comment period which ended in March of 2025. The final version, however, was never published. 2025 marked the first year since 1997 that the U.S. did not release the annual GHG inventory. No comment has been made by U.S. EPA on the status of the reporting program, but this aligns with the current administration’s U.S. EPA deregulatory agenda around GHG and climate change, including the Endangerment Finding repeal in February 2026.
The University of Maryland’s Center for Global Sustainability has published its own Greenhouse Gas Inventory and Analysis for the United States (GHGIA), covering years 1990-2024. The report is designed to be comparable with previous U.S. EPA reports, adhering to good practice outlined by the Intergovernmental Panel on Climate Change (IPCC) and developed in a manner to support continuity with previous reports. However, the report is not an official submission on behalf of the U.S. to the UNFCCC.
Report Key Findings
In the absence of the federal inventory, the University of Maryland’s analysis provides a snapshot of U.S. GHG emissions trends through recent years. The report follows established methodologies to align with prior official inventories and international reporting standards for continuity and comparability purposes.
Overall Emissions Trends
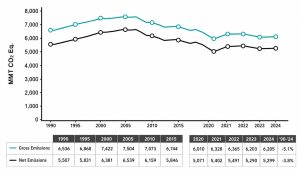
The GHGIA indicates that total U.S. GHG emissions have generally declined from their historical peak in the mid-2000s, continuing a long-term downward trend. This reduction is largely driven by changes in the energy sector, including a shift from coal to natural gas and increased deployment of renewable energy sources. However, recent years show more modest declines, suggesting that further reductions may require stricter policy and technological advancements. Figure 1 compares the Gross vs. Net GHG emissions from 1990 to 2024.
Figure 1
U.S. Gross and Net Emissions
Sector Contributions
Consistent with prior inventories, the largest contributors to U.S. emissions remain:
- Energy (Electric Power and Transportation): The energy sector continues to account for the majority of emissions. While emissions from electricity generation have decreased significantly, transportation remains a leading and more persistent source.
- Industrial Processes: Emissions from industry have remained relatively stable, with some reductions offset by increased production in certain subsectors.
- Agriculture: Agricultural emissions, particularly methane (CH4) and nitrous oxide (N2O), have shown gradual increases, reflecting ongoing challenges in reducing emissions from livestock and soil management.
- Waste: Emissions from the waste sector have generally declined due to improved landfill gas management and regulatory controls.
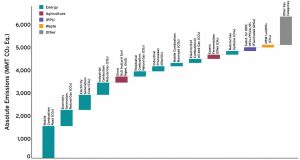
Figure 2 shows the absolute emissions for each sector, highlighting the biggest contributors to the total domestic emissions.
Figure 2
U.S. Emissions Categories and Gross Emissions
Greenhouse Gas Breakdown
Carbon dioxide (CO₂) remains the dominant GHG, primarily from fossil fuel combustion. CH₄ emissions—particularly from natural gas systems and agriculture—continue to represent a significant share, while N₂O emissions are largely tied to agricultural activities. Fluorinated gases, though smaller in total volume, remain important due to their high global warming potential.
Land Use, Land-Use Change, and Forestry
The Land Use, Land-Use Change, and Forestry (LULUCF) sector continues to function as a net carbon sink, offsetting a portion of total U.S. emissions. Forests and other natural lands absorb significant amounts of CO₂, although the strength of this sink can vary depending on land management practices, disturbances (e.g., wildfires), and development pressures.
Comparison to Previous EPA Inventories
The University of Maryland report aligns closely with trends observed in prior U.S. EPA inventories, reinforcing confidence in the general trajectory of U.S. emissions. While minor differences in estimates may arise due to data sources or methodological updates, the overall conclusions remain consistent:
- Long-term emissions reductions are evident but uneven across sectors.
- The power sector has achieved the most significant progress.
- Transportation and agriculture continue to present persistent challenges.
Implications of the Missing 2025 GHG Inventory
The absence of an official U.S. EPA inventory introduces uncertainty into both domestic and international climate reporting. The annual inventory has historically served as the foundation for tracking progress toward emissions reduction goals and fulfilling international obligations under the UNFCCC.
Without an official submission:
- Policymakers may face gaps in standardized, government-verified data.
- International transparency and comparability could be impacted.
- Independent analyses, such as the University of Maryland GHGIA, take on increased importance in informing stakeholders.
Looking Ahead
The University of Maryland’s GHGIA demonstrates that credible estimates of U.S. emissions can still be developed in the absence of federal reporting, while also showcasing demand for the report by stakeholders and regulators. The continuation of the official U.S. GHG inventory remains critical for maintaining consistency, transparency, and accountability in climate reporting.
Future emissions reductions will likely depend on continued decarbonization of the energy sector, electrification of transportation, advancements in industrial processes, and improved land and agricultural management practices. Whether through federal reporting or independent efforts, maintaining a clear and accurate understanding of emissions trends will be essential for guiding effective climate policy.
If you have questions about how to interpret this report or would like to discuss how your company contributes to GHG emissions, ALL4 would be happy to assist. Please contact Louise Shaffer at lshaffer@all4inc.com or your ALL4 Project Manager to discuss how ALL4 can help develop or improve your corporate GHG inventory or develop a strategy to reduce your GHG footprint.