Analysis of the Recent Report “Examining Supply-Side Options to Achieve 100% Clean Electricity by 2035”
Introduction
The National Renewable Energy Laboratory (NREL) is a national laboratory of the U.S. Department of Energy that develops renewable energy technologies and strategies to promote the United States’ energy and environmental goals. In 2022, NREL released a report titled “Examining Supply-Side Options to Achieve 100% Clean Electricity by 2035,” in which they describe a study that evaluated four scenarios to achieve 100% clean electricity by 2035. These four scenarios are:
- All Options: a scenario in which all technologies continue to see improvements in cost and performance consistent with current trends.
- Infrastructure Renaissance: a scenario that assumes improvements in transmission technologies, and permitting and siting approaches allow for higher levels of transmission deployment with higher capacity.
- Constrained: a scenario in which both constraints to deployment of transmission and new generation capacity increase costs to deploy certain technologies, as well as limits the amount that can be deployed.
- No Carbon Capture and Storage (CCS): a scenario that assumes CCS technologies do not achieve the cost and performance needed for cost-competitive deployment.
Summary of Results
In all four scenarios, significant growth in wind energy utilized to create electricity is assumed. In the All Options scenario, the average annual installation rate is about 88 gigawatts (GW)/year over a 10-year period from 2026 to 2035. The average annual installation rate exceeds 60 GW/year over this same time frame for all scenarios. This greatly exceeds the U.S. installations for wind of 14.2 GW in 2020. While the study projects most growth in wind energy will be land-based wind, the offshore wind industry has shown potential for future growth. Although only 42 MW of offshore wind energy was operated in 2020, the U.S. offshore wind project pipeline recently surpassed 35 GW. The Biden administration has announced that the U.S. will target an offshore wind capacity of 30 GW by 2030. Meeting this target would be a significant step toward increasing the United States’ reliance on clean energy.
Just like with wind, the study predicts that there will be an increase in solar energy utilized to create electricity. The cost of deploying utility-scale and rooftop photovoltaics (PV) is expected to decrease by 14-44% due to the decreasing hardware costs of solar panel components. In addition, PV is expected to contribute 20-36% of total electricity supply across the four scenarios and is the largest generation resource in the Constrained scenario.
Additional renewable resources such as geothermal, hydropower, and biopower must also be utilized to achieve 100% clean electricity by 2035. The four scenarios assume declining costs will allow about 8 GW of new geothermal capacity by 2035. In addition, upgrades to equipment that improve power outputs at existing facilities and opportunities for adding capacity at unpowered dams are expected to cause 5-8 GW of new hydropower to be deployed across the four scenarios.
Growth in nuclear energy differed significantly in the four scenarios evaluated. The study expects that research and development efforts will not yield significant cost improvements before 2035, and, as a result, there was no significant growth in the All Options and Infrastructure Renaissance scenarios. However, the No CCS scenario adds 40 GW of new nuclear energy, and the Constrained scenario adds 200 GW of new nuclear energy due to restrictions on renewable energy and transmission deployment that would make nuclear more cost-competitive.
The study compared the costs and benefits of achieving 100% clean energy by 2035 and ultimately concluded that the benefits significantly outweigh the costs. Across the four scenarios, the capital and operating costs from 2023 to 2035 ranged from $330 to $740 billion. In addition, the study evaluated two types of benefits: avoided health damages and avoided climate damages. The study found that costs of avoided health damages were $390 to $400 billion across the four scenarios, which alone outweighed the costs in three of the four scenarios. Finally, the study found that the costs of avoided climate damages were $1.6 trillion on the low end across the scenarios and $4 to $4.3 trillion on the high end across the scenarios.
Conclusions
The study concludes that the benefits of achieving 100% clean energy by 2035 significantly outweigh the cost. However, the article outlines actions that need to be taken to achieve this goal:
- Dramatically accelerating the electrification of demand sectors to get the country on the path to net-zero emissions by midcentury.
- Installing new electricity infrastructure rapidly throughout the country.
- Expanding clean technology manufacturing and the supply chain.
- Accelerating research, development, demonstration, and deployment to bring emerging technologies to the market.
Although this list of actions may seem ambitious, they can be accomplished with enough support. Achieving 100% clean energy by 2035 would be a significant way to make progress toward decarbonization.
If your organization wants to understand the benefits and opportunities of a decarbonization strategy reach out to me at cweiss@all4inc.com.
Common Sampling System Issues that Lead to Errors in Analysis and How to Avoid Them
What Issues May Come Up During Stack Testing?
When stack testing, there are a lot of moving parts that go into the operation to ensure that the stack testing event goes smoothly. Because of this, there are several common issues that may come up during a stack testing event. In this article I will identify some of these issues so that you can avoid errors in data or having to re-test.
Stack testing at its core should be simple: collecting a sample, associating that sample to a process, and analyzing the sample. However, stack testing does not always work out so simply. It is overlayed with all sorts of steps and moving parts that make it complicated and easy to make a mistake. There are at least two types of errors from this process: those that occur in the field (and should be caught in the field), and those that you can’t see in the field but show up during sample analysis. We’ll focus on the back-end errors in this article. Common front-end errors include improper sampling temperature, leak test fails, equipment failure, and incorrect sampling time or rates. These items should be able to be addressed in the field so that your stack testing event is successful.
Issue 1: Contamination
The first type of issue that could show up after the sampling is complete (e.g., on the “back end” of the stack testing process) is contamination or background contribution. Common causes for contamination/background contribution include:
- Dirty testing equipment
- Incorrect materials of construction in the sampling train
- Poor quality of reagents
- Recovery in a bad location
Contamination can be minimized or prevented if you plan to avoid it ahead of time. If you do not take the proper countermeasures the impact could result in invalid data, uninterpretable data, or a retest.
- Dirty testing equipment – For example, the probe may contain residue from a previous test if it was not cleaned. Ensure that equipment is properly cleaned before getting to the field.
- Wrong materials of construction – For example, a chromium stack test needs an all glass (or Teflon) system probe. This should be considered during leadup to the test.
- Quality of reagents – For example, if phosphorus results come back very high in an ethylene cracking plant it may be a result of low-quality reagents in the sampling media. The quality of reagents used during testing should be held to an appropriately high standard.
- Recovery in a bad location – For example, a high concentration of a pollutant in the atmosphere that is not coming from the stack emissions. This is one of the reasons field blanks are used during sampling.
Issue 2: Disconnect Between How Facility is Supposed to Operate and How it is Operated
The second type of issue that could show up on the back end of the stack testing process is the disconnect between how the emissions unit (including control equipment) is supposed to operate and how it is operated during the test. This disconnect can occur when there is an inconsistency between the capability of the emissions unit and the conditions at which the test is performed. This can happen when the test is performed without consulting either the permit or the appropriate personnel at the facility or both. A hypothetical example of this situation would be if the facility is allowed to emit 3 tons per hour at 100% operating capacity according to a permit limit, but a recent stack test was run and the results show emissions of 2.5 tons per hour. This is a good result because compliance with the permit limit has been demonstrated. However, if the recent stack test was run at 75% capacity the facility now may have accepted an operational restriction.
To prevent this from happening, consult the permit and appropriate personnel to ensure that you understand the parameter you are testing and the associated operational restrictions that may result from a test (e.g., production level or control device operation).
Takeaways
This is typically a one-day test about every 5 years, so you have to get it right. Always plan ahead and make sure to consider the potential for contamination and a disconnect between testing and operation before going out to the field. The biggest takeaway from how to avoid these back-end issues is to take the time needed to properly prepare and address:
- The state of the equipment
- The materials of construction of the sampling train
- The quality of reagents
- Recovery location and blanks
- How the emissions unit should be operated during the test
In the words of Gene Youngerman, “the error is always going to be the one you haven’t expected,” so expect anything! If you’d like to discuss how ALL4 can help you plan your next stack test and review the results, please contact me at bjohnson@all4inc.com or Gene Youngerman at gyoungerman@all4inc.com.
U.S. EPA Proposes to Remove TRI De Minimis Exemption for PFAS
On December 5, 2022, U.S. Environmental Protection Agency (U.S. EPA) released a proposed rule pursuant to the National Defense Authorization Act (NDAA) for Fiscal Year 2020 which adds per- and polyfluoroalkyl substances (PFAS) to the list of “Lower Thresholds for Chemicals of Special Concern” under the Toxic Release Inventory (TRI). This proposed rulemaking was much anticipated as it was included as a future action item for U.S. EPA in the October 2021 “PFAS Strategic Roadmap” document. Although the TRI-listed PFAS are already subject to a lower reporting threshold of 100 pounds per year, the classification as chemicals of special concern removes the de minimis exemption eligibility for these chemicals. The de minimis exemption allows covered facilities to disregard certain minimal concentrations of chemicals in mixtures or trade name products. This is similar to how persistent, bioaccumulative, and toxic (PBT) chemicals are currently managed under TRI (e.g., lead, mercury, dioxins). Additionally, the proposed classification would remove the option to use a Form A instead of a Form R for those facilities that trigger reporting for PFAS. The Form A provides facilities the option of certifying on a simplified reporting form. This also means that the option for reporting releases as ranges will be eliminated, which will capture more specific data and give both facilities and U.S. EPA a more accurate picture of air, water, and waste releases. Note that this classification will also apply to all PFAS added to the TRI reportable list in the future.
The proposed rulemaking would also remove the de minimis exemption for purposes of supplier notification requirements to downstream facilities for all chemicals of special concern, which would include PBT chemicals and PFAS. If finalized, suppliers and facilities would be required to provide the specific chemical composition of TRI-listed PFAS in materials and could no longer claim “de minimis” levels as the reason for exclusion of information from a Safety Data Sheet (SDS), or TRI reporting exemption. For reference, the current de minimis concentration threshold for perfluorooctanoic acid (PFOA) is 0.1%, and all other TRI-listed PFAS is 1%.
The intention of this proposed rulemaking is to provide U.S. EPA with a more complete picture of PFAS releases and waste management activities from facilities. Based on TRI data submitted for calendar years 2021 and 2022, U.S. EPA stated that fewer facilities reported PFAS than were expected. For example, in the first year of reporting for the initial 172 listed PFAS, U.S. EPA only received reports from 38 facilities across the country. The removal of the de minimis exemption would require more facilities to report under TRI, thereby providing U.S. EPA with more useful information on their prevalence. Additionally, the intention of this proposed rulemaking is so that purchasers of materials and other mixtures are informed of the presence of PFAS that could otherwise be omitted from SDS or other supplier data. If this rulemaking is finalized, in order to complete threshold calculations, affected facilities should be prepared to track actual amounts of any TRI-listed PFAS-containing materials that were manufactured, processed, or otherwise used, as well as flag materials that are currently listed as “de minimis” but will need to receive actual composition data for.
Comments on the proposed rulemaking must be received by February 3, 2023.
If you have any questions, would like further information, or are interested in preparing comments on the proposed rulemaking, please reach out to me at kturney@all4inc.com. Additionally, please join us in April 2023 for our annual TRI webinar, where we will discuss this change, among others, in more detail. Subscribe to ALL4’s 4-the-Record email service to stay up to date on other blogs, webinars, and training events.
Big Changes for California Annual Emissions Report Starting in 2023
Recent changes to California’s Criteria Air Pollutants and Toxic Air Contaminants Reporting (CTR) requirements, which were designed to establish a uniform system for reporting annual emissions data and collect more data from stationary sources, are set to start phasing in for reporting during the 2023 calendar year. Facilities in California that fit into the following criteria, often referred to as Core Facilities, will be subject to the additional reporting requirements during the 2023 phase-in year for emissions data based on 2022 calendar year operations. The criteria are:
- Is a greenhouse gas reporter required to report to the state board pursuant to California Health & Safety Code Section 38530.
- Has the potential to emit 250 tons or more per year of a criteria pollutant designated nonattainment in the air district by either the National Ambient Air Quality Standards (NAAQS) or California Ambient Air Quality Standards (CAAQS).
- Is an elevated toxics facility as classified by the local air district.
Facilities that are subject to at least one of the three criteria above will, in addition to reporting emissions data historically required by the local Air Pollution Control District (APCD) or Air Quality Management District (AQMD), be required to report additional data such as release location data. Release location data reporting will require facilities to associate each process generating emissions with a physical release location. These requirements include detailed data that can be used to classify the type of source as volume or point. For sources classified as point sources, detailed data for the release is required including but not limited to exact location, height, release temperature, and release exit velocity. Additionally, these Core Facilities will also be required to include TAC emissions from a new list that identifies over 300 new reportable chemicals.
Changes to the CTR reporting requirements for the 2023 calendar year would also affect select facilities in the following AQMD and APCD:
- Bay Area AQMD
- Imperial County APCD
- Sacramento Metropolitan AQMD
- San Diego County APCD
- San Joaquin Valley Unified APCD
- South Coast AQMD
Facilities located in these six air districts will also be subject to annual emissions reporting changes starting in 2023 for calendar year 2022 emissions data. These additional facilities, referred to as Additional Applicability Facilities, must report if they meet one of the following criteria:
- Emit four tons per year of volatile organic compounds (VOC)/reactive organic gases, nitrogen dioxide (NOX), sulfur dioxide (SO2), lead (Pb), ammonia (NH3), or particulate matter (PM).
- Emit or the potential to emit 100 tons per year of carbon monoxide (CO).
- Have an activity or emissions level identified in Table A-3 of the Regulation for the Reporting of Criteria Air Pollutants and Toxic Air Contaminants.
Table A-3 of the Regulation for the Reporting of Criteria Air Pollutants and Toxic Air Contaminants includes reportable activities at any level include the following:
- Metal plating, anodizing, or grinding using cadmium or chromium.
- Plating, polishing, coating, engraving, and allied services, including thermal spraying, using chromium, cadmium, or nickel.
- Petroleum refining and industries related to petroleum refining.
- Industrial machinery manufacturing.
- Release of fumigant or fumigation of crops for market using ethylene oxide, propylene oxide, sulfur dioxide, methyl bromide, sulfuryl fluoride, or phosphine and phosphine-generating processes.
- Rubber and miscellaneous plastics products manufacturing if styrene, butadiene, phthalates, carcinogenic solvents, or isocyanates are used.
- Paint stripping and varnish stripping.
- Dry cleaning facilities, except facilities that only use water or carbon dioxide-based cleaning systems.
Additionally, the following activities are reportable starting in 2023 using calendar year 2022 usage data but only when meeting specific thresholds including the following.
- Select processes emitting 1,4-dioxane when 10 pounds of more of 1,4-dioxane is emitted a year.
- Select industries combusting crude, residual, distillate, or diesel oil. Reportable quantities are dependent on type of combustion device, tier of engine, and/or quantity of fuel combusted.
- Select processes emitting styrene when 1 pound or more of styrene is emitted a year.
- Methylene chloride used for paint or coating removal, printing or print shop cleaning, or aircraft maintenance or repair when 1 gallon or more of methylene chloride is used per year.
- Use of 1 or more gallons of N-methyl pyrrolidone per year.
- Tert-butyl acetate use in aerospace manufacturing and maintenance; fabricated metal products manufacturing; manufacture or use of coatings, inks, adhesives, cleaners, and degreasers; and military facilities when 20 pounds or more of tert-butyl acetate is used in a year.
- Use of parachlorobenzotrifluoride (PCBTF) in cleaning or degreasing solvents, adhesives, printing inks, or coating operations when 5 pounds of 0.5 gallons or more is used in a year.
- Solvent cleaning and degreasing with any volume of solvents designated as human carcinogen or 55 gallons per month of any solvent.
The phase-in schedule that is set to begin in 2023 will continue through 2028 with the goal of phasing-in all California air districts and sectors. If a facility in California has operating permits issued by the local APCD or AQMD there is a good chance reporting requirements will change or, in some instances, start at some point between 2023 and 2028. If you have any questions or would like to review potential reporting obligations, please contact info@all4inc.com.
The State of Georgia State Implementation Plan (SIP) Startup, Shutdown, and Malfunction Policy Disapproval
Introduction
In early 2013, the United States Environmental Protection Agency (U.S. EPA) reviewed each State Implementation Plan (SIP) policy regarding excess emissions during startup, shutdown, and malfunction (SSM) events. The goal was to determine if the SIP portions dealing with excess emissions during SSM events complied with the Clean Air Act (CAA). According to 42 U.S. Code §7410(k)(5), when the EPA finds that SIPs are substantially inadequate to attain or maintain a national ambient air quality standard, the U.S. EPA can call for SIP revisions, referred to as a SIP call.
On June 12, 2015, the U.S. EPA issued a SIP call identifying substantial inadequacy to 36 states, including Georgia. In response, in November 2016, the Georgia Environmental Protection Division (GEPD) submitted revisions to the U.S. EPA. GEPD requested the addition of two new provisions that would allow alternative emissions limitations (AELs) during SSM periods and the option to comply via certain work practice standards. In the proposed decision, published on November 28, 2022, the U.S. EPA proposes disapproving GEPD’s revisions on the basis that they do not correct the deficiencies identified. Comments on the U.S. EPA’s proposed decision are due on or before December 28, 2022. The details of GEPD’s submission and the implications of the disapproval are presented in the following sections.
The Current, Deficient Rule
The current, deficient rule is Georgia Rule 391-3-1-.02(2)(a)7 – Excess Emissions:
- Excess Emissions.
-
- Excess emissions resulting from startup, shutdown, malfunction of any source which occur though ordinary diligence is employed shall be allowed provided that (I) the best operational practices to minimize emissions are adhered to, and (II) all associated air pollution control equipment is operated in a manner consistent with good air pollution control practice for minimizing emissions and (III) the duration of excess emissions is minimized.
- Excess emissions which are caused entirely or in part by poor maintenance, poor operation, or any other equipment or process failure which may reasonably be prevented during startup, shutdown or malfunction are prohibited and are violations of this Chapter (391-3-1).
- The provisions of this paragraph 7. shall apply only to those sources which are not subject to any requirement under section (8) of this Rule (i.e. Rule 391-3-1-.02) or any requirement of 40 CFR, Part 60, as amended concerning New Source Performance Standards.
The Proposed, Disapproved Rules
To address the SIP deficiencies, GEPD proposed to:
- Add two new provisions, Georgia Rule 391-3-1-.02(2)(a)11 – Startup and Shutdown Emissions for SIP-Approved Rules and Rule 391-3-1-.02(2)(a)12 – Malfunction Emissions;
- Allow AELs during SSM periods and the option to comply via certain work practice standards [via the two new, proposed provisions]; and
- Replace Georgia Rule 391-3-1-.02(2)(a)7 – Excess Emissions with the two new provisions.
The full rules can be found on the State of Georgia’s Rules and Regulations website. The U.S. EPA found Georgia’s propositions to be deficient for several reasons:
- The provisions allow alternative work practice standards instead of emissions limits, and EPA found that the provisions do not reflect EPA’s “seven specific criteria for developing alternative emissions limits that apply during startup and shutdown” that were issued as part of the 2015 SSM SIP Action.
- U.S. EPA found that the provisions are not specific enough, meaning there are not requirements for certain source categories.
- U.S. EPA found that some of the provisions are difficult or impractical to enforce.
- U.S. EPA requires emissions limits to apply at all times and found that the new provisions allow for exemptions in certain circumstances.
The Implications
U.S. EPA is accepting comments only on the November 2016 submittal disapproval and whether it addresses the 2015 SSM SIP Call and CAA requirements. If the disapproval is finalized, U.S. EPA must promulgate a federal implementation plan (FIP) within 2 years of the finalized disapproval. A FIP may be avoided if EPA approves a SIP revision from GEPD that corrects the deficiencies within the 24-month period.
If you have any questions about the Georgia’s SSM SIP, the U.S. EPA’s disapproval, or submitting comments, please contact Madison Jones, Consulting Engineer, at mjones@all4inc.com or 678.293.9435. Additionally, if you would like more info on EPA’s SSM SIP policy, refer to ALL4’ article, U.S. EPA Reverses 2015 SSM SIP Policy.
Environmental Justice Tools Update: EJScreen 2.1 and CEJST 1.0
U.S. EPA Releases EJScreen 2.1
On October 11, 2022, the United States Environmental Protection Agency (U.S. EPA) released a new version of their EJScreen tool, EJScreen 2.1. EJScreen is an environmental justice (EJ) screening and mapping tool that combines environmental and socioeconomic information to identify areas that may be considered overburdened. EJScreen 2.1 includes new data and coverage and incorporates several new features. Here are the changes to EJScreen in version 2.1:
New Data
- EJScreen 2.1 now includes environmental, demographic, and index data for the US Virgin Islands, Guam, American Samoa, and the Northern Mariana Islands. Data was not previously available in the tool for these areas. The data sets available for these areas are not as complete as they are for the continental United States, but the data that is available has been incorporated into the tool to begin covering those areas and set the stage for greater coverage in future versions.
- All EJScreen 2.1 data has been updated to use Census American Community Survey (ACS) 2016-2020 5-Year Estimates.
- EJScreen 2.1 now uses the term “Linguistically isolated” instead of “Limited English Speaking” to align with the most recent nomenclature used by the U.S. Census.
- EJScreen 2.1 includes new tribal and indigenous and colonias map layers. Tribal and indigenous areas, like areas with larger percentages people of color and low income, have experienced disproportionate effects of pollution. Colonias areas often have inadequate potable water supply, sewage systems, and/or housing. Both areas are more sensitive to the effects of emissions and pollution and are often considered overburdened.
- Additional data, such as new Superfund source data and new Risk Management Program (RMP) facility source data have been incorporated. A full list of the new data sets added can be found HERE.
New Features
- With the release of EJScreen 2.1, U.S. EPA added Supplemental Indexes. Supplemental Indexes are like EJ Indexes in that there are the same 12 Indexes as the EJ Indexes but the Demographic Index, which is used to weigh the Environmental Indicators and create the EJ / Supplemental Indexes, is calculated differently:
- For EJ Indexes, the Demographic Index is the average of the percent low income and percent people of color Socioeconomic Indicators.
- For the Supplemental Indexes, a new five-factor supplemental demographic index is used, which is the average of percent low-income, percent limited English-speaking, percent less than high school education, percent unemployed, and low life expectancy.
- S. EPA has indicated that while the Supplemental Indexes have been included to allow users to look at the data from a different point of view, they will continue to rely on the EJ Indexes in making determinations as to whether a community is overburdened.
- EJScreen 2.1 now includes threshold maps.
- Threshold maps allow a user to select data type (EJ Index or Supplemental Index), data source (US or State Percentiles), Index Percentile Range, and all indexes or selected subset of indexes.
- This allows a user to evaluate areas for multiple contributors for EJ and supplemental indices. For example, a user can identify areas that have a percentile above 80 for both Air Toxics Cancer Risk and Superfund Proximity and see if there may be a correlation between the two factors, either on a state or federal level. The user can also identify census tracts that have a set number of Indexes over a certain percentile, etc.
Method Changes
- The Method for calculating the EJ index has been updated in the new version. The calculation methods are shown below.
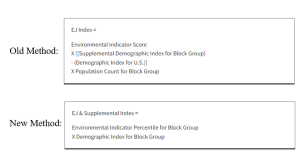
- Percentiles no longer use a floor method and now instead use a ceiling method, meaning it uses the lower value in case of ties instead of higher. This means some areas may now be below the 80th percentile (the commonly accepted threshold for EJ communities) that were previously above.
- The new method results in an index that considers only the environmental impacts and demographic index, which is a more conservative approach than the previous one that also considered population weights.
CEJST Version 1.0
On November 22, 2022, the White House Council on Environmental Quality (CEQ) released the first formal version of the Climate and Economic Justice Screening Tool (CEJST), which identifies communities eligible for funding under the Justice40 initiative by classifying them as disadvantaged.
The Beta release was met with significant criticism from EJ interest groups for excluding race as a metric over legal concerns. Race is partially addressed in the new version of the tool through the redlining indicator. Redlining is a discriminatory practice where services are denied to potential customers who live in communities classified as high risk for investment. These communities often have a high percentage of minority or low-income populations. Other additions include information about climate risks, transportation inequities, and legacy pollution. The tool incorporates a number of new datasets and also an updated methodology for determining whether a community is disadvantaged. The tool identifies an additional 3,781 communities as disadvantaged, including the designation of all Federally recognized tribes as disadvantaged. Communities are considered disadvantaged if they are at or above the threshold for one or more of the eight categories of burden identified by the tool and are at above the threshold for one of the socioeconomic burdens associated with that category. The eight categories of burden are:
- Climate Change
- Energy
- Health
- Housing
- Legacy Pollution
- Transportation
- Water and Wastewater
- Workforce Development
Additionally, a census tract that is surrounded by disadvantaged communities and is at or above the 50th percentile for low income is now also considered disadvantaged.
How to Use the Tools
although many states do not currently require EJ reviews before permitting new sites or any retroactive analyses, it is important to know your facilities’ EJ footprints prior to undertaking permitting efforts to inform what additional requirements might be required or what the public response might be. If you have previously run the tools for your facilities, you may want to look at the new versions of the tools to see if you get different results. The results of the tools should also be considered when siting new facilities. ALL4 recommends that industry engage nearby communities (overburdened or not) to provide a seat at the table to air potential concerns and develop open communication with those communities prior to undertaking projects that may impact those communities.
ALL4 is tracking the status of state and federal EJ tools and the regulatory and policy developments around EJ. If you need help conducting a review of your facility’s EJ footprint or want to discuss what your state is doing in terms of EJ policy and programs, contact your ALL4 project manager or email info@all4inc.com, we’re here to help!
Proposed Rule Mandates CDP Reporting and SBTi Target-Setting for U.S. Federal Suppliers
On November 10, 2022, the White House Council on Environmental Quality (CEQ) announced during the 27th Conference of the Parties to the U.N. Framework Convention on Climate Change (COP27) in Sharm El Sheikh, Egypt a proposal called the Federal Supplier Climate Risks and Resilience Rule. The proposed rule mandates that major federal suppliers will now be required to disclose their greenhouse gas (GHG) emissions and climate-related financial risk through the CDP, an international nonprofit that provides a framework for companies and cities to disclose their environmental impacts, as well as set science-based emissions reduction targets approved by the Science Based Target initiative (SBTi), an initiative of more than 1,000 companies that seek to define best practices in emissions reductions and net-zero targets in line with climate science.1 This rule is in support of President Biden’s Executive Orders on Climate-Related Financial Risk and Catalyzing Clean Energy Industries and Jobs Through Federal Sustainability, helping acknowledge the importance of reducing GHG emissions to combat climate change through transparent reporting and sector collaboration.
As the U.S federal government is the largest purchasing organization in the world, they are at significant financial risk from climate change. The proposed Federal Supplier Climate Risks and Resilience Rule aims to strengthen vulnerable federal supply chains and to reduce climate related risks associated with them. Because the U.S. is a very large consumer of goods and services, both U.S. and global companies will be impacted by the new ruling which will create a catalyst for industry decarbonization across multiple sectors globally. The new rule is “one of the most significant supply chain rules in U.S. history,” as it is taking critical steps to address the climate crisis by reducing the federal government’s supply chain emissions and helping work toward the Biden Administration’s goal of a 50% reduction in GHG pollution by 2030.2
The proposed rule contains three core compliance requirements:
- completion of a GHG emissions inventory,
- the completion of annual climate disclosures, and
- setting science-based targets for GHG emissions reduction.
The proposed rule has grouped contractors required to disclose as either major contractors (receiving more than $50 million in annual federal contracts) or significant contractors (receiving between $7.5 to $50 million in annual federal contracts). Major contractors will be required to publicly disclose their Scope 1, Scope 2, relevant categories of their Scope 3 GHG emissions, and their climate related financial risk utilizing the CDP. Significant contractors will not be required to report climate related financial risk but will only be required to report on their Scope 1 and Scope 2 GHG emissions through the CDP. Contractors receiving less than $7.5 million in annual federal contracts will not be required to report under the Federal Supplier Climate Risk and Resilience Rule.3
In addition to the CDP reporting requirement, major contractors will be required to publicly set science-based emissions reduction targets that must be approved by the SBTi. The SBTi publishes every committed company’s science-based emissions reduction target on their publicly available database allowing for industry-collaboration through increased transparency, and overall educational and technological advances in ways to reduce GHG in various sectors. On the contrary, significant contractors and contractors receiving less than $7.5 million in annual federal contracts will not be required to declare an SBTi approved science-based emissions reduction targets under the Federal Supplier Climate Risk and Resilience Rule.4
Industries that are a larger part of the total federal spend, such as the aerospace, defense, cement, and steel industries, could be most impacted. However, 63% of the total number of companies requested to disclose under the new ruling are already satisfying that requirement by completing the CDP’s annual climate reporting disclosure questionnaire.5 The new ruling will increase the number of federal contractors setting and declaring SBTi-approved science-based targets to reduce GHG emissions. The proposed rule is a clear message to organizations doing business with the federal government that they must confront climate related risks. GHG emissions identification and reporting is a critical step toward further understanding and mitigating the increasing climate related threats to the global supply chain.
There is a 60-day public comment period for this proposed rule that is scheduled to close on January 13, 2023. During this time the public can submit questions, comments, or clarifications to the CEQ for review and consideration.
If you are interested in learning more about the proposed Federal Supplier Climate Risks and Resilience Rule, CDP reporting, SBTi emissions reduction target setting, and/or how to get started with quantifying Scope 1, 2 or 3 GHG emissions, please reach out to ALL4’s James Giannantonio, Managing Consultant of ESG & Sustainability, at jgiannantonio@all4inc.com.
Sources:
- https://www.ropesgray.com/en/newsroom/alerts/2022/november/climate-related-disclosures-and-targets-proposed-for-us-federal-government-contractors-an-overview
- https://www.cdp.net/en/articles/media/in-bold-new-move-biden-administration-makes-cdps-model-the-law.
- https://www.sustainability.gov/federalsustainabilityplan/fed-supplier-rule.html
- https://www.sustainability.gov/federalsustainabilityplan/fed-supplier-rule.html
- https://www.cdp.net/en/articles/media/in-bold-new-move-biden-administration-makes-cdps-model-the-law