Comment Period Extended for General Permit (GP)-5 and GP-5A
The Pennsylvania Department of Environmental Protection (PADEP) has announced that the comment period for the proposed General Permit 5 (for Natural Gas Compressor Stations, Processing Plants and Transmission Stations) and the proposed General Permit 5A (for Unconventional Natural Gas Well Site Operations and Remote Pigging Stations) has been extended until June 5, 2017. The original 45 day comment period, as announced in conjunction with the publication of the General Permits in the Pennsylvania Bulletin on February 4, 2017, was scheduled to end on March 22, 2017. The notice of the extension will be printed in the February 25, 2017 edition of the PA Bulletin. Please contact Roy Rakiewicz 610.933.5246 x127 if you have questions.
For more information about GP-5A, please see our article, “Goodbye Exemption No. 38, Hello GP-5A: Changes on the Horizon for the Pennsylvania Natural Gas Industry” from December 2016.
Confidence, Consulting and Expensive Diplomas
In my opinion, the most important building block for the foundation of a successful career in any consulting field is confidence; Confidence in the advice and guidance that you’re giving to your clients. But you can’t have confidence without knowledge; Knowledge that your guidance is steering your client down the right path.
When I started at ALL4 in February 2012, I knew next to nothing about foundational aspects of air quality, such as The Clean Air Act Amendments of 1990, fine particulate matter, or pitot tubes. Ok, that was a lie. I knew nothing about these things. I had an expensive piece of paper on my wall that said “Diploma,” but zero experience in the world of air quality consulting. So, you can imagine my predicament: zero knowledge begets a lack of confidence. A lack of confidence begets poor consulting.
Luckily for a neophyte like me, and I’m sure for my young colleagues as well, All4’s internal training came to our aid.
ALL4’s beginner level training, given to all technical staff hires, is known as Air Quality 101 (AQ101). It consists of 12, approximately 1-hour sessions. Some of the major topics include:
- The History of the Clean Air Act (CAA)
- Emissions Inventories
- Federal New Source Review (NSR) overview
- Prevention of Significant Deterioration (PSD) regulations
- Non-Attainment NSR regulations
- Operating Permits
- State Implementation Plans
- Continuous Monitoring Systems (CMS) and Stack Testing
- Air Dispersion Model Basics
- Air Quality Modeling Evaluations
- Standards or Performance for New Stationary Sources (NSPS) regulations
- National Emission Standards for Hazardous Air Pollutants (NESHAP) regulations
This training was invaluable for its role in making me a better consultant by giving me the foundational knowledge necessary to guide my clients with confidence. AQ101 not only gave me the tools necessary to follow the federal and state regulations, but also the reason ‘why’ and the history behind the decisions that I was making. In session 1, I learned that George H. W. Bush signed the legislation that would become the CAA Amendments of 1990, and with it, the establishment of the Title V Operating Permit program and the expansion of the NESHAPs. In session 4, I learned that fine particulate matter (PM) is made up of filterable PM (i.e., PM that can be captured on a paper filter during stack testing) and condensable PM (i.e., PM in the gaseous phase, which condenses to sub-micron particles after cooling). Finally, in session 7, I learned that a pitot tube is an instrument used in stack testing to measure air velocity within an exhaust stack.
Recently, ALL4 has received some feedback from our clients that they are in need of this type of institutional air quality training at their companies. One major reason is that the institutional knowledge of those whose careers have paralleled the path of air regulations from the 70’s, 80’s, and 90’s will start to vanish as this group of air quality specialists retire from consulting positions, the industrial sector and the regulatory agencies. Our clients are dealing with that loss today.
So, here are the questions that I have for you: Would you find value in this kind of training in your role? Is this type of foundational-level air quality training missing at your company? How could you do your job better if you received this type of training? And, if you’re responsible for managing a team of people, do you feel like your staff could benefit and perform better if they received foundational training? If so, we’d love to hear about it.
Please reach out to ALL4’s RegTech Education Center leader Dan Holland at 610.933.5246 ext 115 with your respective contact info and he can provide you more information on how he can work with and train you.
Clean Air Act, the Foundation of Air Quality Regulations
ALL4 prides itself on the foundational knowledge of air quality regulations and the historical perspective that accompanies the nearly 50 years of air quality laws and statutes in the United States. However, we recognize that the pool of air quality professionals that have lived these fifty years of air quality regulation is shrinking. Regulatory agencies, industry, and consulting companies are experiencing the loss of foundational knowledge that defines the air quality expert. Therefore, it is the commitment and standard practice at ALL4 that all of our engineers and scientists receive training in the underlying basics of air quality regulatory programs via a 12 session training program. This air quality training program is also available to our clients as ALL4’s AQ101 webinar series.
We have extracted some of the content of our introductory AQ101 session below. Specifically we discuss the Clean Air Act. Some of you may also recognize some of the content as being from our Air Educator series in Pollution Engineering. Periodically we will introduce various components of our AQ101 series as Blog postings.
The CAA and the follow-up amendments (CAAA) serve as the basis for all air quality regulations at the federal level. The CAA represents the intent of Congress and cannot be changed unless there is Congressional action or the courts determine the law to be unconstitutional. The basis for the CAA is contained at Title 42 of US Code (Public Health and Welfare), which is the codification of general and permanent laws of the US. Chapter 85 of Title 42 is Air Pollution Prevention and Control. There are six subchapters to Chapter 85 which have been added or modified by various public laws (e.g., Public Law 91-604 December 1970, the original CAA and Public Law 101-549 November 1990, the CAAA). The six subchapters correspond to the six Titles in the CAA;
- Title I (Programs and Activities),
- Title II (Emission Standards for Moving Vehicles)
- Title III General Provisions
- Title IV and IVa (Noise Pollution and Acid Deposition Control, respectively)
- Title V (Permits)
- Title VI (Stratospheric Ozone)
Within Title I of the CAA are statutes addressing the National Ambient Air Quality Standards (NAAQS), State Implementation Plans (SIPs), special requirements for areas not attaining the NAAQS, hazardous air pollutants (HAPs), standards of controls for stationary sources, New Source Review (NSR) air permitting regulations for major sources, standards for solid waste incinerators, and enforcement of CAA statutes. These components to Title I cover an enormous range of air quality issues.
Title II of the CAA addresses air quality as it relates to emissions from mobiles sources. Oxides of nitrogen (NOX), carbon monoxide (CO), and particulate matter (PM) are addressed under Title II. As a result of Title II, reduced levels of sulfur in fuel were achieved, renewable fuel components to gasoline were implemented, and cleaner combustion engines were developed.
Under Title III, the CAA directs how U.S. EPA should carry out its responsibilities under the CAA. Important parts to Title III include the right of citizens to file suit for violations of emissions standards, provisions for how U.S. EPA must conduct its proceedings under other sections of the CAA, and, as noted in several recent ALL4 blogs about Appendix W to 40 CFR Part 51, address air quality modeling as related to Title I.
The control of acid deposition is the primary focus under Title IV. Specifically, Title IV addresses the need to control emissions of NOX and sulfur dioxide (SO2). The control of emissions is achieved by a permit program and an emissions allowance system.
Next to requirements in Title I, no other section of the CAA has impacted stationary sources more than Title V. Under the comprehensive air permitting statutes in Title V, the various air permits at stationary sources were required to be consolidated into a single, comprehensive air permit. Title V directed states to develop and implement their own air permitting program and to require that affected stationary sources renew their Title V air permits every five years.
Finally Title VI of the CAA addresses the protection of stratospheric ozone. Protection of stratospheric ozone is accomplished through the regulation of ozone depleting substances categorized as either Class I or Class II. Title VI references the Montreal Protocol for expansion of regulatory requirements to regulate ozone depleting substances.
There should be little argument that the CAA is ready for sorely needed updating. Reliance on an understanding of Congressional intent from up to 47 years ago represents a hurdle to addressing how new air quality concerns should be addressed. Whether it is considering climate change or evaluating if economic factors should impact air quality regulations such as the NAAQS, new Congressional intent will provide a clearer path for administering air quality for the next few decades than continued reliance on statutes from 1970 thru 1990.
Refinery Fenceline Monitoring Data of Concern: Now What?
 In the December 2016 edition of 4 The Record (4TR), Nick Leone of All4 Inc. (ALL4) provided insight on where facilities that are subject to the Petroleum Refinery Sector Rule in 40 CFR Part 63, Subpart CC (National Emission Standards for Hazardous Air Pollutants from Petroleum Refineries or Refinery NESHAP) should be in preparation for the benzene fenceline monitoring requirements of the rule. In this 4TR Guest Article, Dr. Volker Schmid of CleanAir Engineering (CleanAir) provides additional insight regarding options to evaluate benzene concentrations of concern that may have been measured during a facility pilot monitoring program. Dr. Schmid is a Business Leader with CleanAir and is the technical lead of CleanAir’s Advanced Monitoring Group. He is responsible for the identification of innovative measurement technologies and their incorporation into services or products offered by CleanAir. He can be reached for questions or comments at vschmid@cleanair.com or at 724.227.0148.
Introduction
With the promulgation of the Refinery NESHAP, facilities that are subject to the rule are required to implement a fenceline monitoring program for benzene with a passive sampling approach using sorbent traps. The compliance timeline for fenceline monitoring does not commence until January 30, 2018. However, many affected facilities have elected to operate passive fenceline samplers as part of pilot studies aiming to assess current ambient benzene levels and evaluate operational trends and seasonal variations in fugitive emissions.
As the number of facilities performing pilot studies has increased, it has become evident that measured ambient benzene concentrations can vary considerably and can reach levels of concern. The regulatory corrective action trigger level of 9 mg/m3 (2.8 ppb) set in the Refinery NESHAP represents the concentration difference between the highest and lowest passive sampler results on the fenceline, effectively correcting the fenceline results for background concentrations. Therefore, an investigation into ambient benzene concentrations of concern will not only have to involve the search for sources within the refinery premises, but may also include sources outside the refinery contributing to the benzene background.
Investigating the root causes of ambient benzene concentrations of concern can be a difficult task when relying on the time-integrated passive sampler results, which represent an average concentration for a 14-day sampling duration. During this period, the gaseous benzene in the air surrounding the sorbent trap in the sampler migrates onto the sorbent at a well-defined uptake rate. This pre-concentrates the sample on the sorbent and results in a highly sensitive measurement with detection limits below 0.1 ppb. However, this sensitivity comes with a compromise, limited temporal resolution, which makes it inherently difficult to locate sources of transient leaks and fugitive emissions. The problem is further compounded by wind direction variability during the extended sampling period, leading facility personnel often wondering what steps to follow when investigating measured ambient benzene concentrations of concern.
Real-time data generating methods
One tool to identify the often transient fugitive emission sources within or outside of an affected facility is to collect time-resolved, real-time concentration data using fenceline monitoring systems. One such approach uses monitors that measure benzene concentrations from one or more discrete points along the fenceline. An example of such a system uses thermal desorption gas chromatography followed by either flame ionization or photoionization detection. This analytical approach can be selective to benzene and has a sensitivity that is comparable to those achieved with the passive sampling approach. However, the spatial and temporal representation of this approach is limited by the number of individual points being measured along the fenceline and the typically lower data update rates associated with gas chromatography, respectively.
Alternatively, there are optical remote sensing methods that measure average pollutant concentrations along an entire linear distance. These “open-path” systems can provide measurements that are representative of benzene concentrations along a section of the fenceline up to several hundred meters in length. Such systems have received much attention for this application due to their promise of comprehensive fenceline coverage and much more frequent data update rates than those of some of the single-point monitors. One of the more prominent optical remote sensing methods being considered is based on Differential Optical Absorption Spectroscopy in the Ultraviolet region of the spectrum (UV-DOAS). In its implementation as an open-path fenceline monitoring system, UV light is transmitted through ambient air towards a retroreflector array consisting of multiple individual mirrors. The mirrors reflect the light back to a detector where it is spectrally analyzed. Benzene molecules in the traversed air mass absorb light in the UV at very specific wavelengths. The resulting absorption spectrum and corresponding benzene concentrations are derived during spectral analysis. Figure 1 illustrates the open-path UV-DOAS approach.
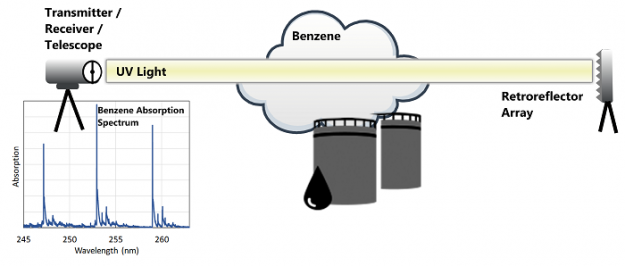
Figure 1. Schematic of an Open-Path Monitoring System
Selection Considerations
The single-point as well as open-path monitoring methods are technologically advanced systems. Their selection and use require numerous consideration and compromise. Attempting to implement complete fenceline coverage for an entire facility with either approach can become cost-prohibitive very quickly. Sensitivity is another consideration. While recent research and development efforts have increased the sensitivity of optical remote sensing systems such as open-path UV-DOAS, the current detection limits of most UV-DOAS systems are about 1 ppb in a 100-meter optical path. While this provides for a highly sensitive measurement, it is not sufficient to use these systems for continuous compliance monitoring.
With a corrective action trigger level of 2.8 ppb of benzene required by the Refinery NESHAP, a detection limit of 0.3 ppb or less is desirable. This favors pre-concentrating single-point monitors because they can provide the necessary sensitivity. However, the low data update rates and limited fenceline coverage restricts its use in this application.
Benefits of Open-Path Systems
Ultimately, the current sensitivity, specificity to benzene, ability to provide frequent data updates, and a larger fenceline coverage with a single system can make open-path UV-DOAS systems a useful diagnostic tool. For example, they can be used to help determine root causes when time-integrated passive sampler data show ambient benzene concentrations of concern at the fenceline. Such data is especially helpful when trying to distinguish between nearby and upwind sources of benzene emissions from outside the facility that contribute to background concentrations. Contributing sources can include neighboring industrial facilities, fueling operations, combustion sources, as well as nearby highways or roads. Because many contributing sources generate transient short-term emissions, the rapid response from a UV-DOAS system can help to identify their location when paired with local meteorological data. In fact, this approach can be used to locate and map ground-level plumes by positioning the optical path of the instrument in the vicinity of suspect contributing sources or by installing multiple retroreflector arrays for a finer spatial resolution of the measurement. In conjunction with real-time meteorological data, this approach can form the basis for a back-trajectory analysis to locate the contributing sources. A schematic of such a ground-plume locating setup using open-path technology and a permanent implementation of that concept at a petrochemical plant is shown in Figure 2.
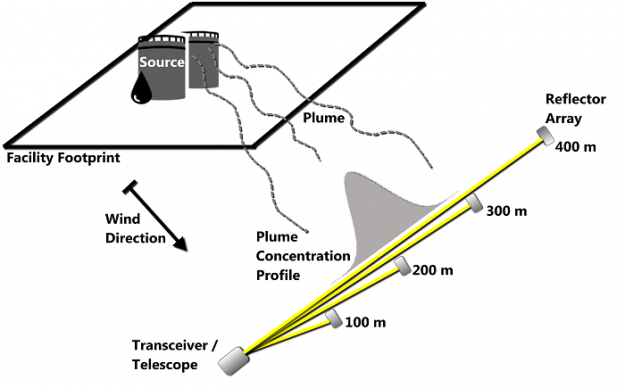
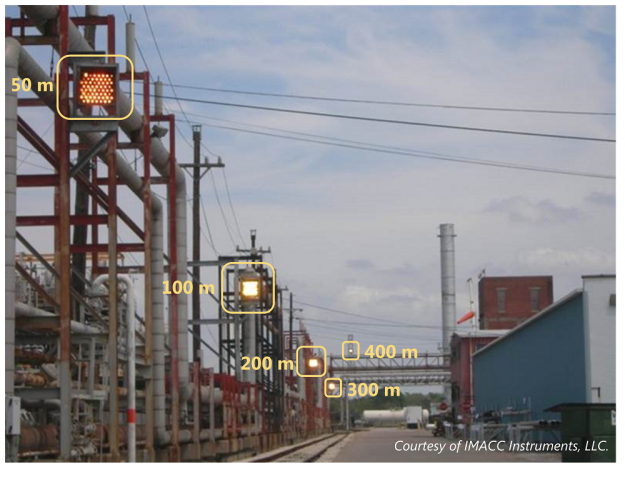
Figure 2. Ground-Level Plume Location Detection
So what about those concentrations of concern at my fenceline?
This leads back to the initial question: I have performed a fenceline monitoring pilot study using passive samplers and measured ambient benzene concentrations of concern. What can I do now?
First of all, although the compliance date is still a year away, it is prudent to investigate the origin of measured ambient benzene concentrations of concern to clarify the emissions profile of the facility and to identify possible contributing sources, both inside and outside of the facility. In addition, measured ambient benzene concentrations of concern can indicate process leaks and result in a loss of product, or under some circumstances lead to potentially unsafe working conditions. Secondly, when compliance monitoring begins next year, the concentration difference between the sampler result and the background levels, will determine if corrective action is triggered. Therefore, before embarking on a possible expensive investigative journey, there is need to correct the passive sampler results in question for background levels.
Here are some additional suggested actions to consider during the investigative process.
- Validate passive sampler results by investigating quality control parameters. Check the sample chain-of-custody transfer sheets for an unbroken chain of custody and for consistency. Passive sampler results are as much a function of sampling location as they are of measurement errors due to potential deployment, handling and analytical errors.
- Critically evaluate and isolate background contributions. Evaluate the location of potential background contributors with respect to the location of the passive sampler, taking into consideration prevailing local wind conditions during the sampling event. Investigate unusual local meteorological conditions that could have led to contributions from unexpected interfering sources. Background contributions can originate from transient nearby as well as cumulative far-field sources. Consider adding extra passive samplers around suspected sources to allow for better spatial resolution to isolate background contributions.
- Once the data are established to be of sufficient quality and ambient benzene concentrations of concern are verified to have originated from within the facility, consider adding extra passive samplers around suspected sources to improve spatial resolution, which will help to identify facility hot spots. Look for neighboring sample locations with significantly different measurement results and add extra passive samplers.
- Reconcile measured results at the location of interest with operational, maintenance and safety logs, as well as other relevant process documentation. Consider local wind conditions during the sampling event. Also consider increasing passive sampling frequency to allow for better temporal resolution of contributing emission sources.
- If the passive sampling results and associated local meteorological data do not clearly identify facility contributions to ambient benzene concentrations of concern, consider targeted diagnostic monitoring using time-resolved, real-time data generating fenceline monitoring systems such as open-path UV-DOAS. Emission contributions can be transient. Accordingly, real-time monitoring instrumentation can provide valuable information about the extent of the plume at ground level. The same approach can help locate interfering transient background sources.
- Choose real-time fenceline monitoring paths that provide enough spatial resolution and sensitivity to perform a trajectory analysis that identifies the emissions source. Enlist the appropriate facility internal resources to respond to ambient benzene concentrations of concern during enhanced monitoring studies.
Conclusion
The initiation of benzene fenceline monitoring at affected petroleum refineries for compliance purposes is January 30, 2018, less than one year from now. Many affected petroleum refineries have already completed trial programs to evaluate ambient benzene concentrations at the fenceline and to gauge contributions from neighboring facilities, combustion sources, as well as nearby highways or roads to the fenceline results. Contributing local sources as as well as facility-specific fugitive emissions can be transient in nature and difficult to resolve and identify using the time-integrated measurement results of passive samplers.
Time-resolved real-time monitoring systems such as open-path UV-DOAS can provide a useful diagnostic tool for identifying and isolating transient background or facility-specific contributions to the fenceline results. Installing a real-time monitoring system at sections of facility boundaries that have shown repeated ambient benzene concentrations of concern can be of value for mapping the plume and identifying contributing sources. The ultimate goal is to understand the emission profile of the facility and to identify local contributing sources outside of the facility well ahead of compliance deadlines.
Appendix W Revision: The New Era of Air Quality Modeling – (Re)Introducing MMIF, an Alternative Option for Met Data
As a self-described computational meteorologist, I get pretty obsessed with weather models, especially models of severe storms like hurricanes or big winter storms. If the coverage on the local news or weather networks is any indication, I don’t think I’m alone in this. My love for weather modeling makes me particularly excited for the Appendix W revision, and there is a specific Appendix W revision that should also pique your interest. Read on and I will tell you why!
In order to do any kind of air quality modeling, it is necessary to have knowledge of the state of the atmosphere that pollutants are being released into. The previous version of 40 CFR Part 51, Appendix W offered two options for meteorological input: one year of on-site monitored meteorology or five years of data from an off-site weather station with meteorological conditions representative of the project site. Either of these two options could be a barrier to our clients due to the cost and time associated with developing on-site meteorological data, or the sacrifice that occurs when “representative” meteorological data are used to simulate the dispersion conditions at a client’s facility. With the December 2016 revisions to Appendix W, a new option is available that allows for the use of representative prognostic model data. The data can be processed through the mesoscale model interface program (MMIF) as input to AERMET in situations where on-site monitoring is prohibitive or infeasible, and where representative monitored data are not available or the best choice.
The basics: what’s a prognostic model?
A prognostic model is a model that can also be used for weather forecasts. Specifically, it uses equations of fluid motion to evolve the state of the atmosphere, represented at its most basic by a three-dimensional grid of winds, temperature and pressure. In the case of a weather forecast, the state of the atmosphere is evolved to a future time. The results of the prognostic model can also be used to give hourly meteorological information at model grid points where meteorological measurements may not have been made. This means that if we can use the hourly results from a prognostic model as input to AERMET, then it’s possible to have meteorological data at an area representative of the project site (or right at the project site, really!).
An example of a prognostic model is the Weather Research and Forecasting (WRF) model, not to be confused with Star Trek’s Worf. WRF is widely-used, and it’s the prognostic model recommended and used by the United States Environmental Protection Agency (U.S. EPA) and the National Weather Service (NWS). WRF can be run and specifically tailored to a project site, or a previously developed WRF data set that is appropriate to a project site may be used as input.
Let’s get into the details: how do we incorporate prognostic data?
With representative prognostic model data from the most recent three years, it’s time to set up MMIF to process the data into a form appropriate to input to AERMET. For regulatory applications, Appendix W states that MMIF should be used to generate input for AERMET rather than straight to AERMOD, although direct to AERMOD processing is an available option in MMIF.
MMIF will generate a surface file and an upper air file that are appropriate for input to AERMET and are the analog of a surface file from a NWS station and an upper air file from a balloon sounding. MMIF will also generate an output file with surface characteristics that is equivalent to the output from the AERSURFACE program, which is a step that is required when running AERMET for on-site or NWS meteorological data.
With the MMIF output files in hand, these files can be used as input to AERMET, and the air quality modeling approach proceeds as it would for air quality modeling applications using representative NWS data or on-site meteorological data. The option of using prognostic model data for air quality modeling applications provides an additional choice that may be time saving and cost saving for some applications.
Between the three choices of input meteorological data for air quality modeling applications, using existing NWS data are the most cost-effective approach but only when the data are truly representative of your project site. Using on-site meteorology is a solid answer in challenging situations where otherwise representative data are not available and where precision and certainty in modeling results is required. However, setting up an onsite monitor and collecting data can cost between $50,000 and $250,000, and you have to wait for one year of data collection. The use of MMIF with prognostic model data as meteorological input provides a middle ground for situations where representative NWS data are not the preferred choice and the time to collect one year of onsite data is not practical.
Wrapping up: do you need assistance?
If you are facing an air quality modeling project, on-site data are not available, and National Weather Service data may not be the best choice for your facility, you are a candidate for prognostic meteorological data. ALL4 is here to help you evaluate any and all meteorological options for your air quality modeling project. Our experienced meteorologists, air quality modelers, and meteorological modelers are ready to provide solutions that cover all the meteorological input data bases: off-site representativeness analysis and meteorological data processing, on-site meteorological monitoring, AND use of prognostic model data through the MMIF tool. Should you have any questions, don’t hesitate to contact Dan Dix (ddix@all4inc.com, 610.933.5246 x118), or anyone else on ALL4’s air quality modeling team if you have any questions and want to know more.